GraphPad Prism Overview
The preferred analysis and graphing solution purpose-built for scientific research. Join the world’s leading scientists and discover how you can use Prism to save time, make more appropriate analysis choices, and elegantly graph and present your scientific research.
Key Features of GraphPad Prism
- Organize Your Data Effectively
Prism is specifically formatted for the analyses you want to run, including analysis of quantitative and categorical data. This makes it easier to enter data correctly, choose suitable analyses, and create stunning graphs. - Perform The Right Analysis
Avoid statistical jargon. In clear language, Prism presents an extensive library of analyses from common to highly specific— t tests, one-, two- and three-way ANOVA, linear and nonlinear regression, dose-response curves, binary logistic regression, survival analysis, principal component analysis, and much more. Each analysis has a checklist to help you understand the required statistical assumptions and confirm you have selected an appropriate test. - Get Actionable Help As You Go
Reduce the complexity of statistics. Prism’s online help goes beyond your expectations. At almost every step, access thousands of pages from the Prism User Guides. Learn from video lessons, guides and educational materials through Prism Academy. Browse the Graph Portfolio and learn how to make a wide range of graph types. Tutorial data sets also help you understand why you should perform certain analyses and how to interpret your results. - One-Click Regression Analysis
No other program simplifies curve fitting like Prism. Select an equation and Prism does the rest—fits the curve, displays a table of results and function parameters, draws the curve on the graph, and interpolates unknown values. - Focus on Your Research, Not Your Software
Prism handles the coding for you. Graphs and results are automatically updated in real time. Any changes to the data and analyses— direct entry of data, omitting erroneous data, correcting typos, or changing analysis choices—are reflected in results, graphs, and layouts instantaneously. - Automate Your Work Without Programming
Automatically add multiple pairwise comparisons to your analysis with a single click. For customization options of these lines and asterisks, simply click the toolbar button again. Make adjustments to the data or the analysis, and the results displayed on the graph will update automatically. - Countless Ways to Customize Your Graphs
Explore countless ways to present a single data set. Select the visualization style that most clearly tells the story contained within your data. Simply choose a graph type, then customize it in real-time with changes to how the data are arranged, the style of the data points, labels, fonts, colors, and much more. The customization options are endless. - Explore Your Data
Focus your efforts on analyzing the most relevant data. Customize how you present the relationships in the data to effectively explore large data sets. Notice something interesting? Highlight a single data point to explore its corresponding properties. With Prisms’ robust data wrangling capabilities, you can both save time and ensure that your analysis is based on clean and well-structured data. - Export Publication-Quality Graphs With One Click
Reduce time to publish. Prism allows you to customize your exports (file type, resolution, transparency, dimensions, color space RGB/CMYK) to meet the requirements of journals. Set your defaults to save time. - Collaboration. Simplified.
Avoid those messy email threads and use Prism Cloud to share, view and collaborate on your Prism projects. Safeguard the interoperability and reusability of your results with Prism’s open access file format. By using industry-standard formats (CSV, PNG, JSON, etc.), you can ensure that your projects can be utilized outside of Prism to open up new possibilities for your data workflows and integrations.
GraphPad Prism System Requirements
Below are the minimum system requirements for running the GraphPad Prism
| Processor: | Intel Pentium 4 or later. |
| RAM: | 2 GB available memory. |
| Windows: | 11, 10, 8.1/8, 7. |
| Space: | 500 MB available space. |
GraphPad Prism Changelog
Below is the list of changes made to the current version of GraphPad Prism.
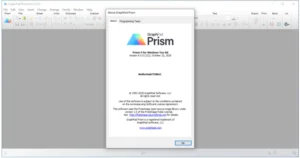
GraphPad Prism Screenshots
How to use GraphPad Prism?
Follow the below instructions to activate your version of GraphPad Prism.
- Install software using given installer (in Setup folder)
- Close program if running (Even from system tray)
- Extract “Crack-Keygen.zip” file and Copy prism.exe to program’s installation folder (confirm replacing, if asked)
- Use Keygen for Activation
- That’s it, Enjoy!
GraphPad Prism Details
Below are the details about GraphPad Prism.
| App Size: | 261.9 MB |
| Setup Status: | Untouched |